Have you ever looked at your Google Analytics reports and notice that there was one specific day where your website received a lot of traffic? Or maybe there was a two day period where your conversions were extremely low.
Or. . . Do you ever wonder what caused those stats and wish you could remember what was going on with your digital marketing and website during that time? For example, maybe you started a new marketing campaign or announced a new service on the day your website traffic spiked. And, maybe your website was down for maintenance on the days with low conversion rates.
It would be nice to remember these things, wouldn’t it? Well, with Google Analytics annotations, you can!
What are Google Analytics annotations?
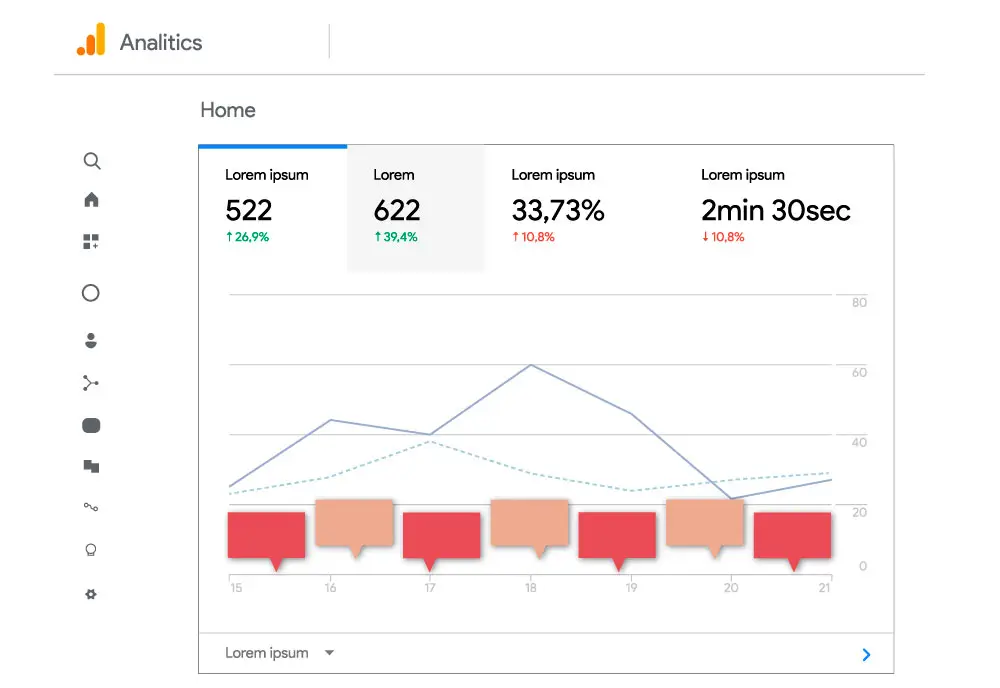
Annotations in Google Analytics essentially allow you to add a note on the over-time graph of your website’s data.
For example, you could add an annotation for the date of a new marketing campaign launch, so you can track how well your marketing efforts are working. A week later, you may notice your website is down, and it isn’t fixed for a couple days. You add an annotation for these dates as well to note that your website was not running during this time.
Then, when looking at your graphs/reports the month or so later, there will be a little icon on each date where an annotation has been made, so you can refer back to each note that has been added. Rather than having to rack your brain to figure out what caused these spikes and dips in your Analytics graphs, you’ll have some easily accessible notes that tell you exactly what happened!
These are some of the most common instances where using Google Annotations is helpful….
- When your site has gone live or changed themes [[When you launch a brand new website or webpage!]]
- When major SEO updates go live
- When you start or stop blogging
- When you start major campaigns or marketing efforts (i.e. Pinterest commitments)

Why you totally NEED Google Analytics annotations
Using Google Analytics annotations eliminates guesswork: when you review your analytics reports weeks or even months later, you’ll know what happened to cause a certain jump or drop in your numbers for that specific day.
It’s a HUGE bummer when you see an anomaly in your Google Analytics stats but can’t remember what caused it. You’ll probably spend lots of time trying to figure out what exactly went down. This is inefficient and frustrating! (We know it would make us want to pull our hair out!)
PLUS, utilizing Google Analytics annotations will give you great insight into what IS actually working for your site. You’ll get to see the exact ways (and numbers) about how your marketing efforts are actually bringing more traffic to your site, increasing conversions, etc. Once you know what your sweet spot is (AKA what marketing techniques your audience loves and responds to) you can focus your time and resources on those things.
Other considerations about Google Analytics annotations
As you implement annotations into your analytics tracking, there are a few things to keep in mind…
- The annotations you make will not be included when you export your reports. If you choose to export your reports as a PDF, there will be a little annotation icon, but you will not be able to see the actual note you left.
- Another thing to consider is that annotations will transfer across reports in the same view of your Google Analytics. For example, an annotation on the “Audience Overview” report will also appear on the “Behavior – New vs Returning” report.
- One slight downside to GA annotations is that you can’t choose a specific time for an annotation, only the date. If you’d like to have an actual time for your annotation (i.e., “website went down at 2pm” or “campaign launched at 7am EST”), we recommend writing out the time in your annotation comment.
Gain clarity about your website data with Google Analytics annotations!
All of the numbers, statistics, spikes, and dips in your website data don’t mean anything if you don’t know what caused them. That’s why you’re tracking your website stats, right? To see what is and isn’t working. To really see how your data ties into what’s happening with your business in the real world, annotations are a must!
So what are you waiting for? Start adding annotations to your Google Analytics reports TODAY!
If you want to use annotations, but don’t have a Google Analytics account set up yet, let’s start there! Check out this post to learn how to set up your GA account.
Enjoy this post? Pin it for later…


