

We love Google Analytics at Marketing Queen! As Peter Drucker infamously said, “What gets measured, gets managed.” Measuring the effectiveness of your marketing is so, so important for making sure you’re using your resources (money AND time) wisely.
Why? Because there’s no sense doing something that doesn’t give you any kind of return on investment!
Previously, I blogged about the four basic stats to watch when you’re getting started with Google Analytics, and then where to find even more helpful stats, like referral sources and visitor behavior.
But now we’re going even deeper into those referral sources to find out which sites are sending you the most traffic…and what you can do with that information.
More importantly, we’ll go through a Marketing Queen Case Study for how we were able to improve this client’s traffic quantity and quality by zooming in on where the traffic was coming from.

What Can You Learn from the Traffic Sources Report in Google Analytics?
Essentially, the Traffic Sources report tells you where your site visitors are coming from—and what those visitors do once they’re on your site. If visitors from one particular source are more likely to buy, that would be really good to know!
On a monthly or quarterly basis, you want to review:
- What were the traffic sources that sent people to your website this month?
- How many visits did you receive from each?
- What was the quality of the visitor from that source? (i.e., How many minutes did they spend on your site, and how many pages did they look at? Or, did they bounce off your site immediately? ← That would be a low-quality visitor, in case you couldn’t tell.)
And, if you’re using any paid advertising, you want to ask the same questions:
- Which ads or media sites sent you traffic? How many visitors from each?
- What was the quality of the visitor from each source, in terms of page visits and time spent on the site?
- Based on all of that information, should you change how you’re investing your media dollars?
All of this is great info you can get from the Traffic Sources report in Google Analytics. Pretty valuable, right?
Quick Case Study: The Power of Blogging!
Let’s take a look at my client, who we’ll call Lily’s Lilies (or LL for short) for this case study. First, they hired Marketing Queen so we could build them a brand-new WordPress website. Three months later after we finished the build, LL started blogging weekly. Once their metrics went up, they reduced their blogging frequency to every other week.
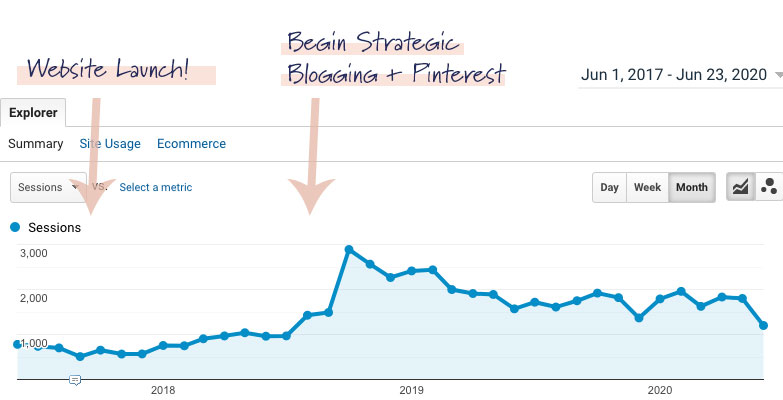
In July 2018 there was a slight increase when the website was launched. Then LL started blogging, and the increase became significant month over month. Once they switched to blogging every other week, the traffic leveled out but remained nearly triple to what it had been pre-blogging.
I’ll repeat that. A new website + consistent blogging = TRIPLED THE TRAFFIC!
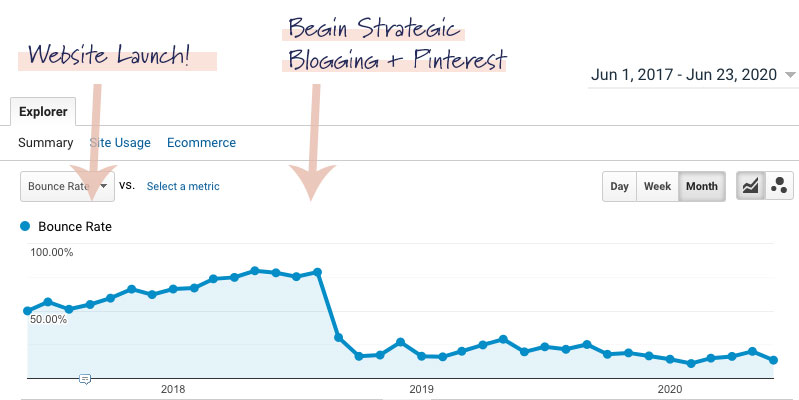
But to be sure, we dug deeper. We could see that the new traffic was in fact visiting LL’s site intentionally. These visitors weren’t landing on the site by accident. How do we know? The bounce rate dropped significantly as blogging continued. See that massive drop in the bounce rate:
Now to Look at Those Referral Sources
In addition to tracking website sessions and the bounce rates, LL tracked referring sites—specifically Pinterest, because they’d started to be strategic about their Pinterest marketing.

Their Pinterest traffic followed the same pattern as blogging—as they’ve sustained their Pinterest efforts, so has their traffic remained at triple the rate as it was two years ago.
YOUR ANALYTICS CAN SAVE YOU MONEY
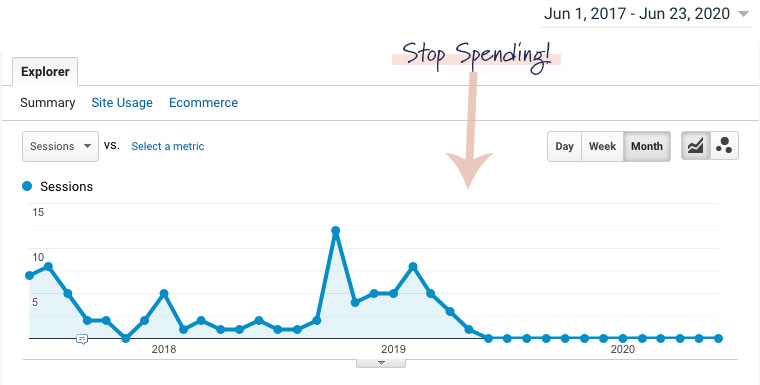
You can also measure how your paid social media is performing in your Google Analytics dashboard. Early on, LL was paying for a profile with a media site. But after 18 months of a very small amount of traffic, they decided to cancel that contract. See, what gets measured, gets managed! And in this case, “managed” means “reallocated resources.”
YOUR ANALYTICS CAN SAVE YOU TIME
Remember how I talked about the quality of the traffic? You can do this by comparing these metrics:
- Bounce rate
- Pages per visit
- Average duration of time spent on site
Here’s a sample of LL’s social media traffic. It looks at the traffic coming in from four social media outlets over a six-month period of time. By looking at these we can determine:
- Should we alter our messaging?
- Spend more time on that platform?
- Or less time?
Take a look at each of these.

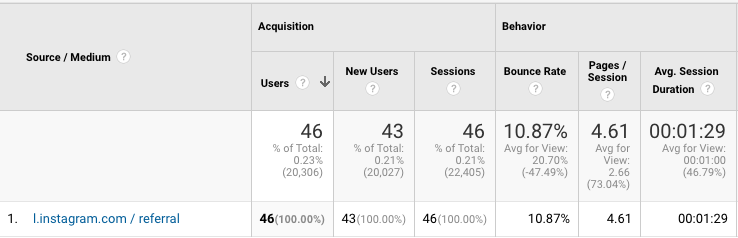


What did you notice about their social media traffic? Facebook brings in the most traffic. But is it high-quality traffic?
Let’s compare it to Instagram. Don’t be fooled by the fact that Instagram only brought in 46 visitors. The bounce rate is a quarter of Facebook’s, and they looked at double the number of pages, and spent more time on the site. These are some very engaged Instagram users!
———————————–
Side note about Instagram: Instagram is never an insta-driver of traffic. It takes time. But if you’re strategic about your usage, you’ll grow your following and be able to have designated campaigns that push traffic, as well as get the ability to swipe-up on your content.
———————————–
Based on this information, it probably makes sense for LL to invest their time with Instagram more than other channels. They can experiment with messaging, imagery, timing, and their cadence to increase the number of people coming through that funnel? Will their quality stay the same or improve? Or will it decline?
What Do Your Referral Sources Tell You?
If you’re anything like me, you’re itching to look at the Traffic Sources Report in Google Analytics! Remember, don’t just look at the number of visits. Be sure to dig into the quality of that traffic so you can identify where to spend more or less of your time and resources.
Did you enjoy this blog post? Pin it for later…