![A woman holds a smartphone in the side view and is seriously analyzing the graph. © [Photographer's name] / Adobe Stock](https://marketing-queen.com/wp-content/uploads/elementor/thumbs/MarketingQueenGoogleAnalytics_0080-qktw8pk7sxboekhimzb5925up1y82qsan5aabs7paq.webp "A woman holds a smartphone in the side view and is seriously ana")


Google Analytics is a powerful (and free) tool for understanding whether or not your website is performing. You can use it to gain insights about everything from the number of people who visit your website to which blog posts are your “greatest hits” year after year.
All of that sounds pretty great, right? There’s just one problem:
- Which numbers are you supposed to pay attention to?
- How do you know if those numbers are “good”?
- And, what in tarnation are you supposed to do with that information?
Or, more simply: How on Earth do you even use Google Analytics?
Today I’m excited to introduce the formula I use with all of my clients who are just getting started with Google Analytics. I call it the Rule of Four. It lays out 4 easy stats to watch, and the initial milestone that you want to reach with each of them:
40 users per page
4 pages per visit
4 minutes per visit
40% or less bounce rate
Initially, these are the four most important metrics to pay attention to in Google Analytics (users per page, pages per visit, etc.). The specific numbers I’ve provided are an initial set of goals to achieve by quarter in your marketing.
The Rule of Four is simple yet powerful. Let me break it down.
Rule of Four #1:
Are we attracting enough visitors?

To start, most clients will want to know how the top of their marketing funnel is working. This is called the Awareness phase. (see more about funnel phases here) Are people aware of your business and that it exists? One way to measure this is to look at the quantity of visitors (traffic) your website gets.
I encourage my clients to strive for 40 unique users per day on the site (about 1200 per month or 3600 per quarter). This number will make more sense once we get to Rule #4.
Rule of Four #2 and #3:
Are we encouraging visitors to read more about us?

While Rule One was about quantity, Rules Two and Three are about quality. You want those 40 users to be of high quality: meaning, they’re relevant to your business, and potential customers.
Since you can’t ask them, how can you tell? I tell my clients to look at the visitors who:
- Spend close to four minutes on your website, and
- Visit / read an average of four pages per visit.
These two metrics work together to focus you on people who visited your site and were actively engaged with your content. We’re not interested in people who visited your site and then forgot to close the tab. We’re also not interested in people who quickly clicked through several pages, didn’t find what they’re looking for, and closed your site.
But…someone who spends about four minutes looking at four pages…they’re very interested in you!
These metrics also provide another insight: do we have a minute’s worth of content on our pages? Meaning: is there enough content to help people get to know, like, and trust you? And, does your content ask for the sale? Even a micro-conversion, such as subscribing to your email newsletter list, is a valuable way to gauge interest.
Rule of Four #4:
Are we presenting high-quality content our visitor wants to stick around to digest?
We can measure the quality of our content by looking at the bounce rate.
Someone once explained the bounce rate to me as the percentage rate of people that click on a link to your site, puke, and leave immediately.
And by “puke” we mean “did NOT find what they were looking for.”
For example, pretend you’re a caterer for weddings and special events. You look in your Google Analytics and discover the blog post you wrote about your new iPhone gets about 200 unique visits per day. WOW, right?
You’re so excited until you look at the bounce rate on that blog post. It’s 100 percent. (Insert sad tuba sound.) That means every single person who came to the page didn’t find what they were looking for, so they left. It kind of makes sense, however, because you’re a caterer, not an iPhone seller or tech blogger.
This is where your marketing strategy comes into play. Is blogging about your new iPhone going to get you new clients and customers? Or is blogging about weddings, catering, appetizers, and foodies more likely to attract the people you want?
The way to keep your bounce rate under 40 percent is to make sure each page really speaks to each of your site visitors. The message you write to lure them to the page (attracting them to click the link) actually matches what you’re giving them as your page loads.
There’s no such thing as a 0 percent bounce rate because web spiders and bots are often included in these numbers. So a bounce rate under 40 percent is fantastic, actually. It means people come to your page and get what they wanted.
Why this number? Well, we do like the number four!
But really, if 40% of users are (possibly) bounces, that’s really only 26 humans. If your online store is open 24/7, your marketing efforts should ideally be attracting at least that many per day!
So You’ve Met Your Initial Goals – Now What?
Congratulations, you’ve met your initial goals of 40 users per page / 4 pages per visit / 4 minutes per visit / 40% or less bounce rate! And, you’ve done it consistently for three months now!

Now what?
Now it’s time to grow your goals. You want to double (or triple!) Rule One to 80 or 120 users per page… and still maintain the Rule of Four for Rules Two, Three, and Four.
If you’re doubling it, your goals would look like this:
- 80 users per page
- 4 pages per visit
- 4 minutes per visit
- 40% or less bounce rate (so 48 humans on your site)
You want to increase Rule One every time you meet your goals for three months in a row.
(If you’re in the wedding industry, you can’t compare your site analytics from quarter to quarter. Read this post to find out how to take advantage of cyclical marketing – and how to measure it.)
Mini-Case Study for the Rule of Four
Numbers are great…but you still have to do something with those numbers. That’s where our quarterly strategy sessions come in. We look at the past quarter’s analytics for your site, review your goals, and identify pages we can tweak to improve your funnel and bring you closer to your goals.
For example, here’s an insight we unlocked for one of our clients during a recent quarterly strategy session.
This client had great traffic and based on the trends we saw quarter-to-quarter, we focused on being more intentional with the CTAs.
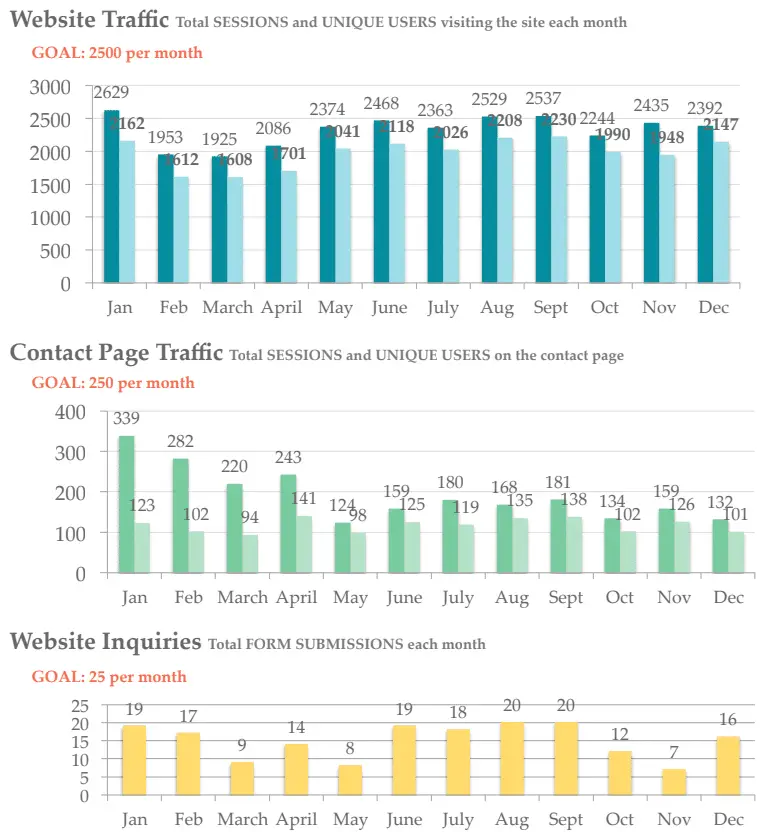
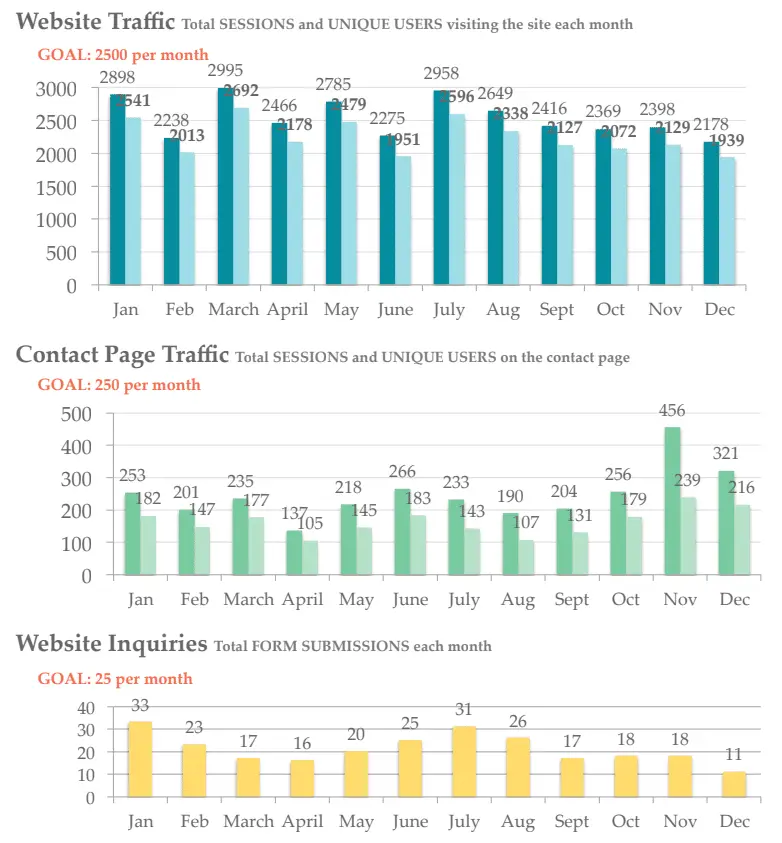
Her traffic gains were modest. In the first year, she had 23,791 visits from unique users. And in year two, she had 27,055, which is “only” a 13.7% increase.
But she had a much higher-quality result: while her traffic only increased a bit, you’ll notice the number of inquiries made via her website made the biggest jump year-to-year.
That first year, she got 179 inquiries. In the second year, she got 255 inquiries – that’s a 42% increase in leads!
YEAR ONE
YEAR TWO
Help! You Fell Down a Google Analytics Hole and You Can’t Get Out!
If you’re still not feeling confident about finding these metrics and applying their insights in a consistent way – Marketing Queen is here to help.