

Previously I told you about the four most important Google Analytics metrics for business owners to watch (read The Rule of Four post). Understanding those numbers will unlock so many insights for you about your website content!
To recap:
40 users per page
4 pages per visit
4 minutes per visit
40% or less bounce rate
Of course, the insights don’t stop there. Once you’ve gotten the Rule of Four down, there are even more places in your dashboard to look!
In this post I’m going to tell you how to learn:
Where are they coming from?
Which pages do they like?
Which pages bring them in (and which pages make them say ‘Girl Bye’)?
Let’s take a look at why these metrics are important and how to find them.
Acquisition >> New Traffic >> Sources / Medium
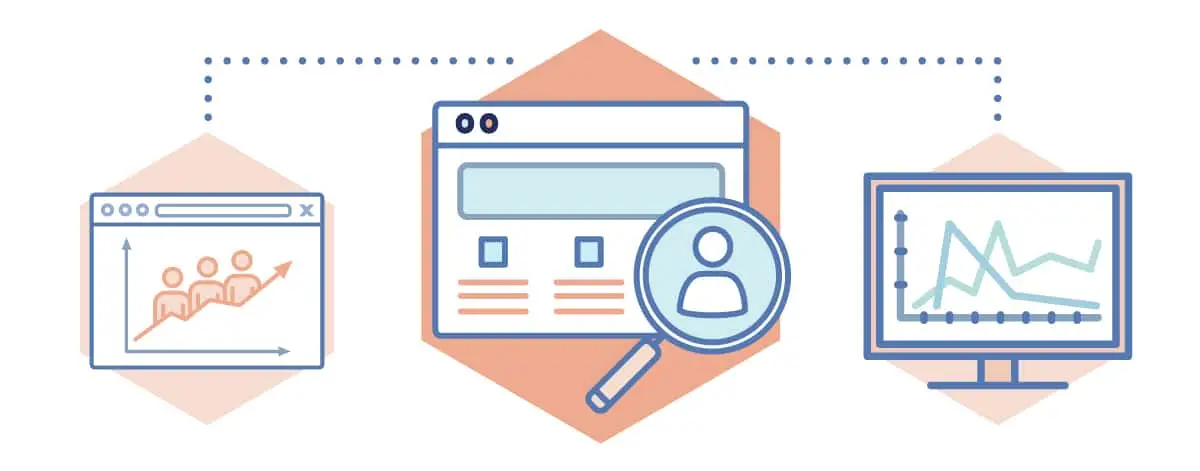
Where is your website traffic coming from? Put another way, how are you acquiring these visitors?
These are important questions to answer so you know where to spend your time and resources getting more traffic (and as we know from the Rule of Four blog post, increasing traffic is the way to increase leads). For example, if you’re sharing your content on your Facebook page, but you’re not getting much traffic from Facebook as a result – you need to ditch that zero and get yourself a hero! And by zero/hero, I mean a different strategy. You might need to adjust your messaging, the audience receiving those messages, or leaving the medium altogether.
I tell my clients to look at where their traffic comes from to make good decisions about where to spend their marketing time (Facebook, guest blogging, etc.) and dollars (Facebook ads, The Knot, WeddingWire, etc.). There’s nothing wrong with experimenting with a new medium as long as you measure the results and adjust accordingly.
Behavior >> Site Content >> All Pages
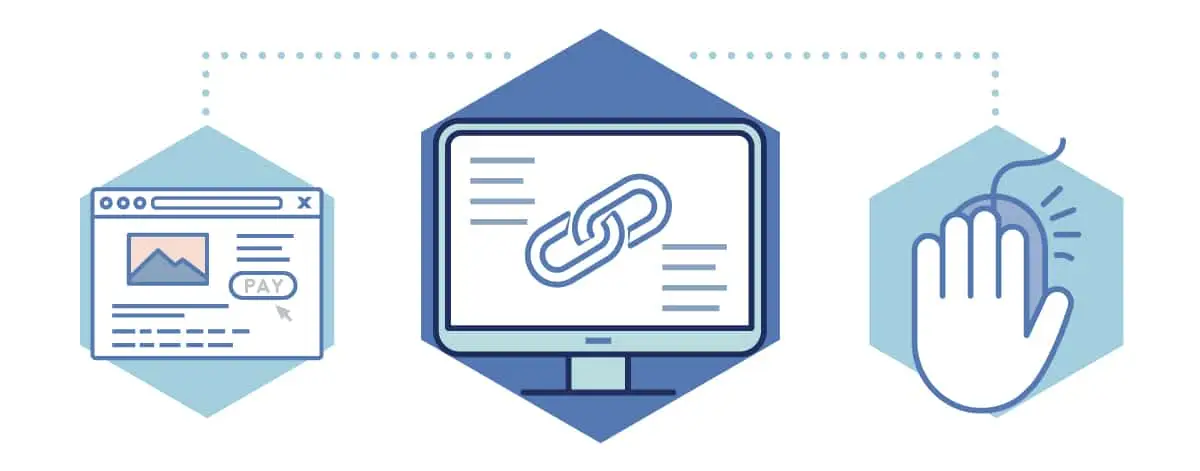
The All Pages report will tell you how each individual page on your website is performing. How many views is each page getting? This number applies to any point in a user’s visit (each visit is called a ‘session’).
In this area of your dashboard, you’ll see a detailed list of your top 10 most visited pages of your website. What pages do you see there – and which pages don’t you see there (that should be there)?
Dive into this information to see where your site visitors are looking (and where they’re not). For example, if your Contact page isn’t in the top 10, you need to know why! The deeper you dive in, the more you’ll learn. It will lead you to add more CTAs (to your Contact page perhaps) or to blog more about a particular topic.
Behavior >> Site Content >> Landing Pages and Exit pages
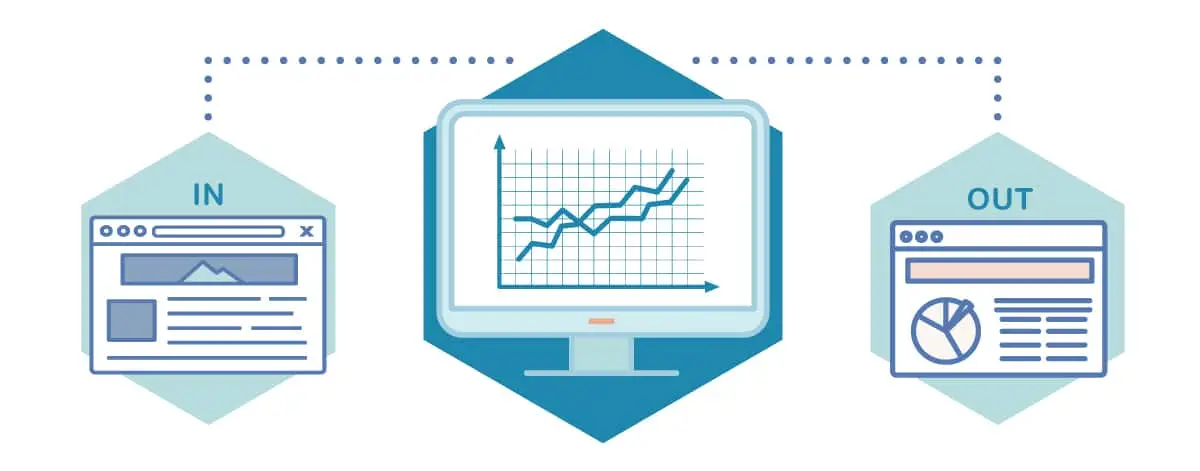
A Landing Page = any page that initiates a session on your site – is the first point of entry to your website. It could be a blog post or a specific website page.
An Exit Page = the very last webpage that loaded before a visitor left your website.
The Landing Page report will tell you what page is bringing visitors to your site. The report shows you how many sessions were started via these pages. (Don’t forget to look at the Source / Medium dimension to understand what brought them there.) These can be telling and very helpful when creating an editorial calendar – you can see what lures them in!
Looking at your Exit Pages will show you on what individual page your visitors decided they were done looking at your site. Ideally, this number will be highest on the Thank You page that a user visits AFTER making a purchase or submitting an inquiry form *wink wink*. (Reminder: Exits are not the same as Bounces. In short, a bounce means they landed on a page and immediately left without looking at any other pages.)
Don’t get overwhelmed by all of this information. Marketing Queen is here to help!
Now that you’re loaded up with light bulbs you can make so many good decisions about your marketing time and dollars. But if you’re not sure how to apply these insights to your marketing lures, posts, page designs, and calls-to-action, Marketing Queen can help.
We provide 2-hour training sessions to help you learn how to get the most from your metrics. Get in touch with us today if you want to schedule a session.
Featured image credit to Adobe Stock NicoElNino